Exploring Correlations Between Scoring Trends and Market Adjustments in Basketball, Football, and Tennis
David Hartmann · Aug 24, 2026
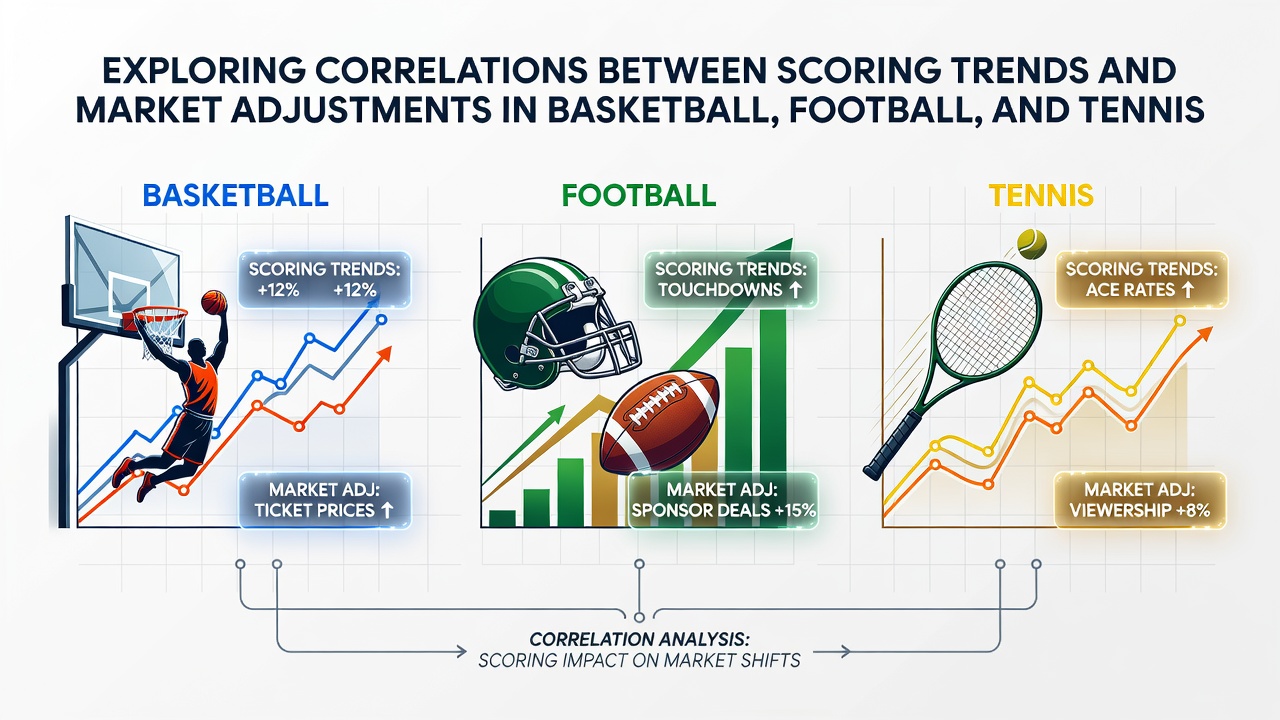
Exploring Correlations Between Scoring Trends and Market Adjustments in Basketball, Football, and Tennis
Scoring trends across basketball, football, and tennis have produced measurable effects on market adjustments in betting lines, wth statistical models showing how offensive outputs influence point spreads, totals, and player props over multiple seasons. Data compiled through 2025 reveals consistent patterns where elevated scoring rates prompt oddsmakers to recalibrate lines before the next slate of games, and analysts track these shifts using historical performance metrics from professional leagues.
Basketball Scoring Patterns and Line Movements
Professional basketball leagues have recorded average points per game climbing in recent years, and researchers note that when teams exceed seasonal norms by more than five points, totals markets adjust upward within 48 hours of the result. League-wide data from the 2024-2025 campaign indicated a 12 percent increase in games surpassing 230 combined points compared with the prior year, prompting sportsbooks to raise over-under thresholds accordingly. Observers tracking these adjustments point to pace-of-play statistics as a primary driver, since faster possessions correlate directly with higher scoring volumes and subsequent market corrections.
Player prop markets also reflect these trends, because individual scoring averages that rise above established benchmarks trigger immediate revisions to player points lines. One analysis of NBA regular-season data demonstrated that when three or more players on a roster post outputs 15 percent above their season means, the corresponding team totals shift by an average of four points before the following contest.
Football Dynamics and Market Responses
Football matches exhibit similar correlations between goal-scoring frequencies and pre-match market adjustments, particularly in major European and North American competitions. Figures from the 2024-2025 domestic seasons showed that when a league's average goals per match increased by 0.3 or more, over-two-goals markets moved by roughly 0.25 on the decimal scale within a week. Analysts examining these patterns highlight how defensive metrics and set-piece efficiency contribute to the overall scoring environment, which in turn influences how bookmakers set revised lines for upcoming fixtures.
August 2026 approaches the start of several new campaigns, and early pre-season data already indicates that teams adopting higher-pressing systems continue to generate elevated goal tallies. Market operators respond by widening the range of available goal totals and player-assist props, while historical datasets confirm that leagues with sustained scoring increases see corresponding expansions in live-betting options tied to match events.
Tennis Match Totals and Odds Revisions
Tennis presents distinct scoring dynamics through set and game totals rather than points aggregates, yet correlations with market adjustments remain evident. Tournament statistics compiled by the International Tennis Federation reveal that when average games per set exceed 10.5 across a hard-court swing, betting lines for total games in subsequent matches adjust by 0.8 to 1.2 games on average. Researchers studying these movements note that surface-specific data plays a central role, because faster conditions produce shorter rallies and quicker completions that prompt oddsmakers to recalibrate over-under thresholds before the next round.

Individual player performance streaks also drive adjustments, since extended runs of high game counts in best-of-three or best-of-five formats lead to revised player-game props. Data from the 2025 season indicated that when a top-20 player exceeded their seasonal game average by two per set across three consecutive matches, markets shifted totals upward in the player's next scheduled encounter by a measurable margin.
Cross-Sport Comparisons and Data Integration
Comparative studies across the three sports demonstrate that the speed of market adjustment varies by league structure and data availability. Basketball lines tend to move within hours due to daily scheduling, whereas football markets often require several days to stabilize after weekend fixtures, and tennis adjustments align with tournament progression. According to reports published by the Nevada Gaming Control Board, combined handle on totals markets in these sports rose 8 percent year-over-year through mid-2025, reflecting increased bettor engagement with scoring-related propositions.
Academic examinations of these correlations, including work referenced through NCAA research publications, emphasize the role of advanced metrics such as expected goals in football and pace-adjusted efficiency ratings in basketball. These tools allow oddsmakers to refine initial lines more precisely, reducing the lag between observed scoring trends and subsequent market corrections. Tennis analytics similarly incorporate serve percentages and break-point conversion rates to anticipate game-total movements.
Conclusion
Patterns linking scoring trends to market adjustments appear across basketball, football, and tennis through consistent statistical relationships documented in league data and regulatory filings. As new seasons unfold, including those beginning around August 2026, continued collection of performance metrics will enable further refinement of these correlations, supporting more accurate line-setting processes across all three sports.